Data Source
For this experiment, we will use the below script to generate and populate the Players table which is named as (tbl_Players)
-- Drop the table if it exists IF EXISTS (SELECT * FROM sys.objects WHERE name = N'tbl_Players' AND type = 'U') DROP TABLE tbl_Players GO SET ANSI_NULLS ON GO --Create the table CREATE TABLE tbl_Players ( PlayerID INT IDENTITY, PlayerName VARCHAR(15), BelongsTo VARCHAR(15), MatchPlayed INT, RunsMade INT, WicketsTaken INT, FeePerMatch NUMERIC(16,2) ) --Insert the records INSERT INTO tbl_Players(PlayerName, BelongsTo, MatchPlayed,RunsMade,WicketsTaken,FeePerMatch) VALUES('A. Won','India',10,440,10, 1000000) INSERT INTO tbl_Players(PlayerName, BelongsTo, MatchPlayed,RunsMade,WicketsTaken,FeePerMatch) VALUES('A. Cricket','India',10,50,17, 400000) INSERT INTO tbl_Players(PlayerName, BelongsTo, MatchPlayed,RunsMade,WicketsTaken,FeePerMatch) VALUES('B. Dhanman','India',10,650,0,3600000) INSERT INTO tbl_Players(PlayerName, BelongsTo, MatchPlayed,RunsMade,WicketsTaken,FeePerMatch) VALUES('C. Barsat','India',10,950,0,5000000) INSERT INTO tbl_Players(PlayerName, BelongsTo, MatchPlayed,RunsMade,WicketsTaken,FeePerMatch) VALUES('A. Mirza','India',2,3,38, 3600000) INSERT INTO tbl_Players(PlayerName, BelongsTo, MatchPlayed,RunsMade,WicketsTaken,FeePerMatch) VALUES('M. Karol','US',15,44,4, 2000000) INSERT INTO tbl_Players(PlayerName, BelongsTo, MatchPlayed,RunsMade,WicketsTaken,FeePerMatch) VALUES('Z. Hamsa','US',3,580,0, 400) INSERT INTO tbl_Players(PlayerName, BelongsTo, MatchPlayed,RunsMade,WicketsTaken,FeePerMatch) VALUES('K. Loly','US',6,500,12,800000) INSERT INTO tbl_Players(PlayerName, BelongsTo, MatchPlayed,RunsMade,WicketsTaken,FeePerMatch) VALUES('S. Summer','US',87,50,8,1230000) INSERT INTO tbl_Players(PlayerName, BelongsTo, MatchPlayed,RunsMade,WicketsTaken,FeePerMatch) VALUES('J.June','US',12,510,9, 4988000) INSERT INTO tbl_Players(PlayerName, BelongsTo, MatchPlayed,RunsMade,WicketsTaken,FeePerMatch) VALUES('A.Namaki','Australia',1,4,180, 999999) INSERT INTO tbl_Players(PlayerName, BelongsTo, MatchPlayed,RunsMade,WicketsTaken,FeePerMatch) VALUES('Z. Samaki','Australia',2,6,147, 888888) INSERT INTO tbl_Players(PlayerName, BelongsTo, MatchPlayed,RunsMade,WicketsTaken,FeePerMatch) VALUES('MS. Kaki','Australia',40,66,0,1234) INSERT INTO tbl_Players(PlayerName, BelongsTo, MatchPlayed,RunsMade,WicketsTaken,FeePerMatch) VALUES('S. Boon','Australia',170,888,10,890) INSERT INTO tbl_Players(PlayerName, BelongsTo, MatchPlayed,RunsMade,WicketsTaken,FeePerMatch) VALUES('DC. Shane','Australia',28,39,338, 4444499) INSERT INTO tbl_Players(PlayerName, BelongsTo, MatchPlayed,RunsMade,WicketsTaken,FeePerMatch) VALUES('S. Noami','Singapore',165,484,45, 5678) INSERT INTO tbl_Players(PlayerName, BelongsTo, MatchPlayed,RunsMade,WicketsTaken,FeePerMatch) VALUES('Z. Biswas','Singapore',73,51,50, 22222) INSERT INTO tbl_Players(PlayerName, BelongsTo, MatchPlayed,RunsMade,WicketsTaken,FeePerMatch) VALUES('K. Dolly','Singapore',65,59,1,99999) INSERT INTO tbl_Players(PlayerName, BelongsTo, MatchPlayed,RunsMade,WicketsTaken,FeePerMatch) VALUES('S. Winter','Singapore',7,50,8,12) INSERT INTO tbl_Players(PlayerName, BelongsTo, MatchPlayed,RunsMade,WicketsTaken,FeePerMatch) VALUES('J.August','Singapore',9,99,98, 890)
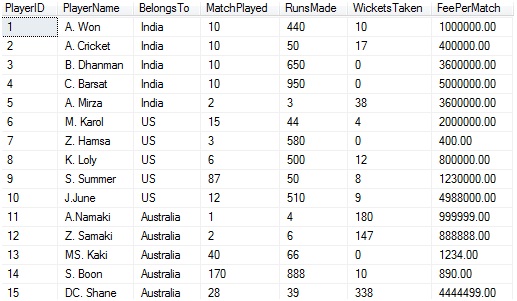
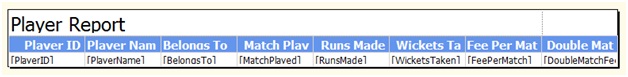
The partial output after running a simple Select query
Select * from tbl_Playersis as under
We will also have the below stored procedure created in our database whose script is as under
If Exists (Select * from sys.objects where name = 'usp_SelectRecordsByPlayerName' and type = 'P') Drop Procedure usp_SelectRecordsByPlayerName Go -- Create the stored procedure Create Procedure [dbo].[usp_SelectRecordsByPlayerName] ( @PlayerID int ) As Begin Select PlayerID ,PlayerName , BelongsTo , MatchPlayed ,RunsMade ,WicketsTaken ,FeePerMatch From tbl_Players Where PlayerId = @PlayerID End
(A) Creating a SubReport in SSRS
A report within another report is a sub report. That is there will be two reports one the Master and the other the child where the master will invoke the child report. The child report or sub report can accept parameters from the master report and will execute its work. Moreover, it can be executed independently. Let us step into action.
Step 1:We will have two reports. The steps to be followed for both the reports are same only in the case of master report we will execute the below query
SELECT [PlayerID] ,[PlayerName] ,[BelongsTo] FROM [SSRSExperiment].[dbo].[tbl_Players]
And for the Subreport we will execute the below query
SELECT [PlayerName] ,[MatchPlayed] ,[RunsMade] ,[WicketsTaken] ,[FeePerMatch] FROM [SSRSExperiment].[dbo].[tbl_Players] WHERE [BelongsTo]= @CountryName
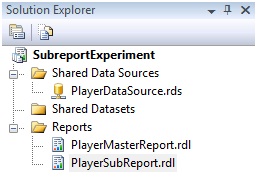
Note that, we are passing the @CountryName parameter. So at runtime based on the parameter value passed , the sub report will be generated. Once the reports are created we will have two reports in our project as shown below
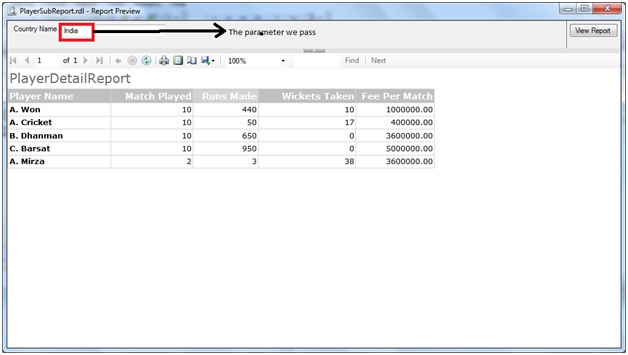
Testing the PlayerSubReport alone yields the below result
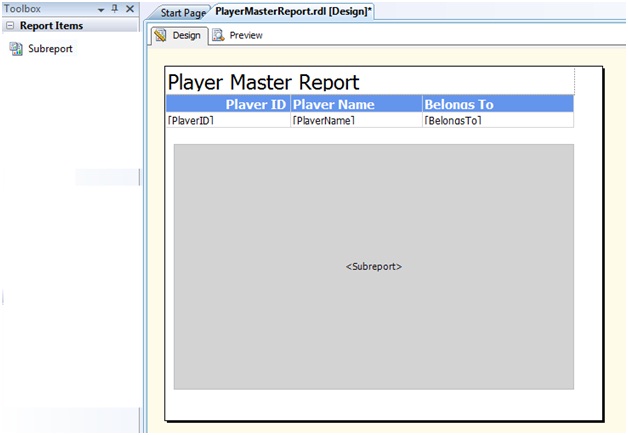
Step 2:Add a SubReport control in the main/master report.
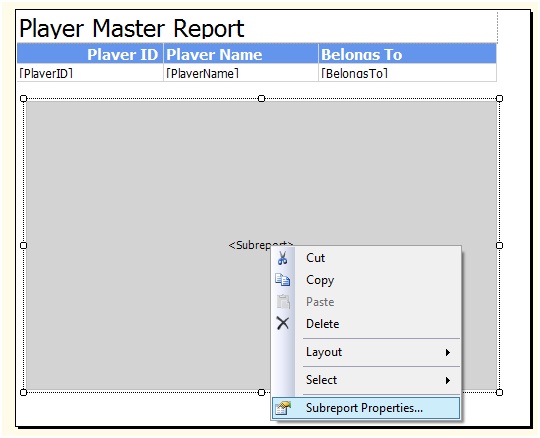
Step 3:Right Click on the Subreport -> Subreport Properties
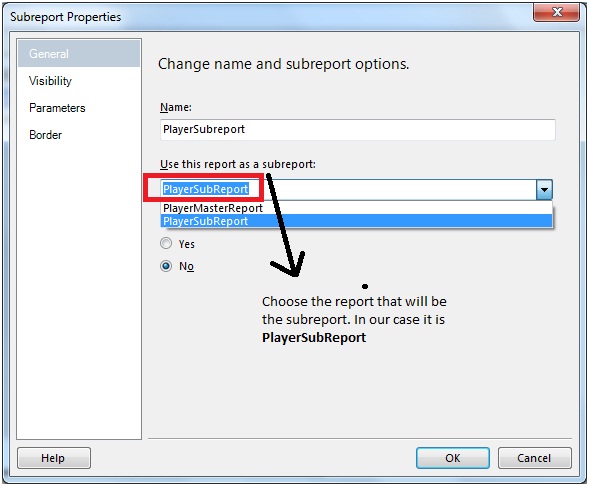
Step 4:From the General section of Subreport Properties window, select the subreport name (here it is PlayerSubReport) from the dropdown as shown below
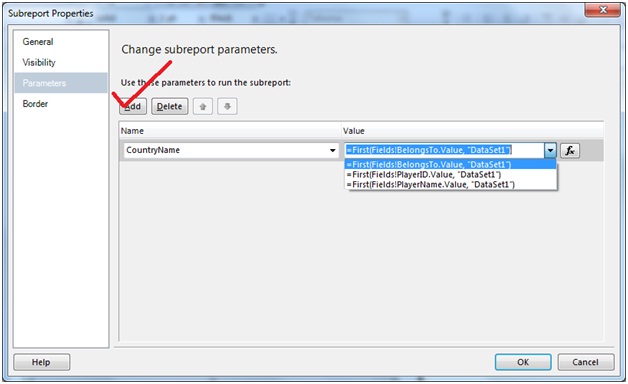
And from the Parameters tab after clicking on the Add button, let us eneter the Parameter name as"CountryName"and the value as " =First(Fields!BelongsTo.Value, "DataSet1")". Once done , click on OK button
Step 5:That's it. Now let us run the report
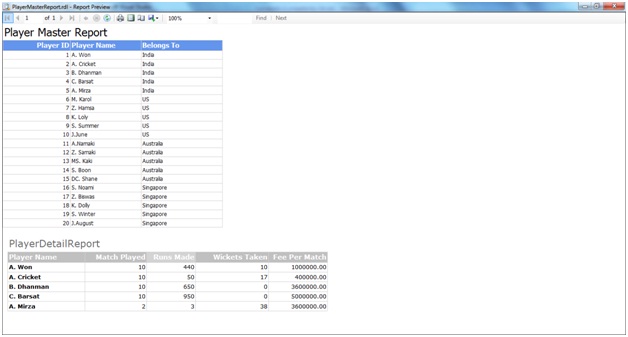
So our Subreport has been generated.
(B) Creating a DrillDownReport in SSRS
Creating a drill down / Tree view report in SSRs is very simple.Let us see the following steps to do so.
Step 1: Open BIDS and creatre a new Shared Data Source
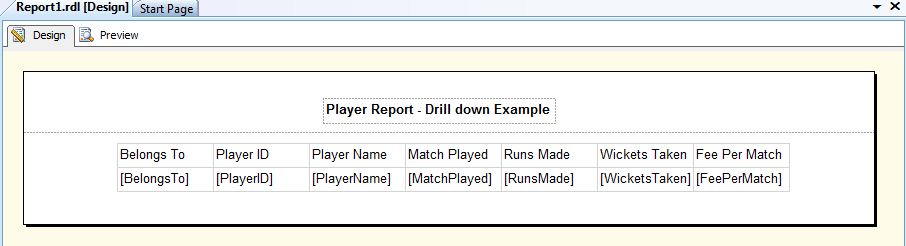
Step 2: Create a Table type report as shown below (The steps for doing so has been described in Part I series).
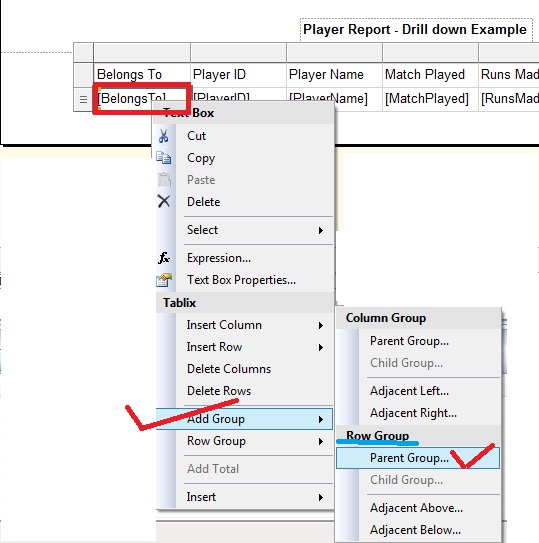
Step3: Next add Parent Group for Belongss To field as depicted under
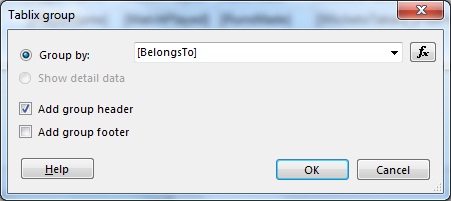
Step 4: From the Tablix Group window, let us choose [BelongsTo] from Group By DropDown and check Add Group Header checkbox, then click OK.
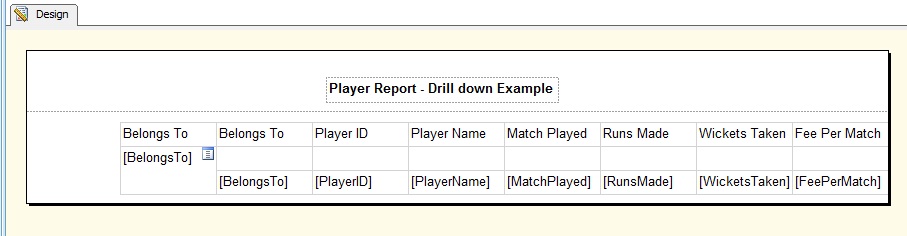
At this point if we the report looks as under in the design view
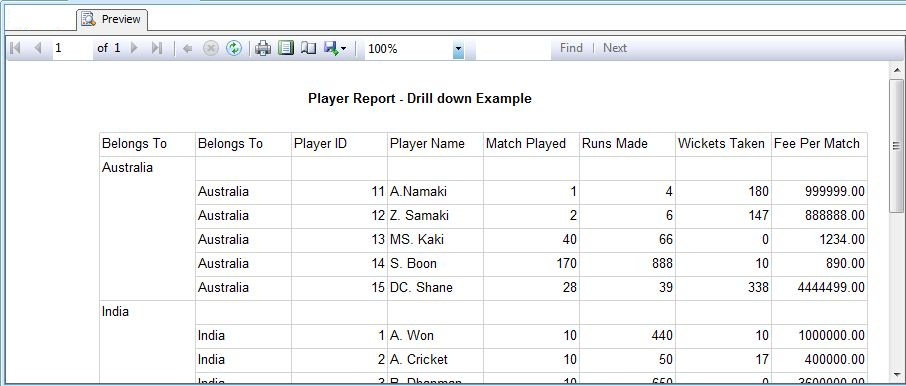
While running the report gives the below impression in the Preview tab
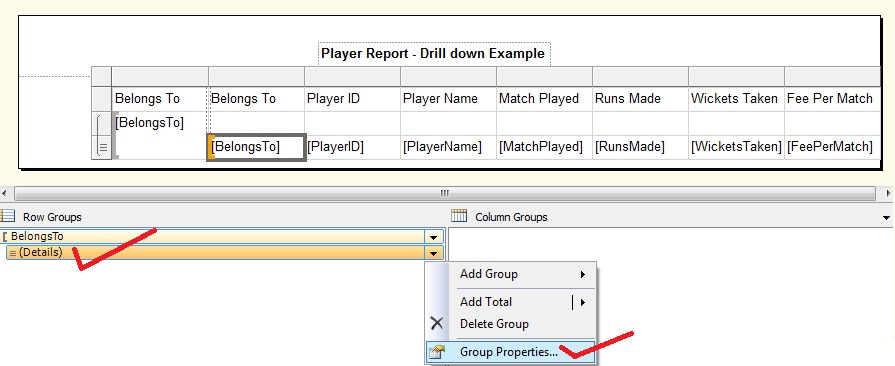
Step 5: From Row groups, choose [Belongs To] Details and then choose Group Properties
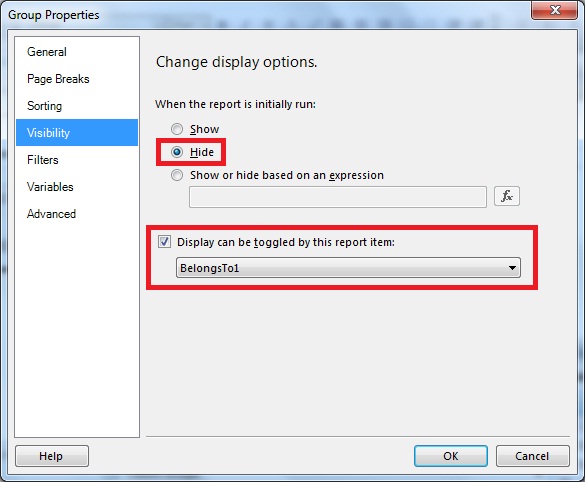
Step 6: From the Group Properties window that opens up, choose Visibility tab. Then select Hide radio button and check the Display can be toggled by this report item checkbox.Then from the drop down that will be enable,select the name of the group (which is BelongsTo1 here) then click on OK
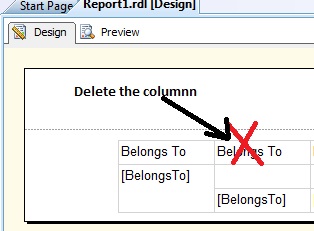
Step 7: Delete the [Belongs To] Details column
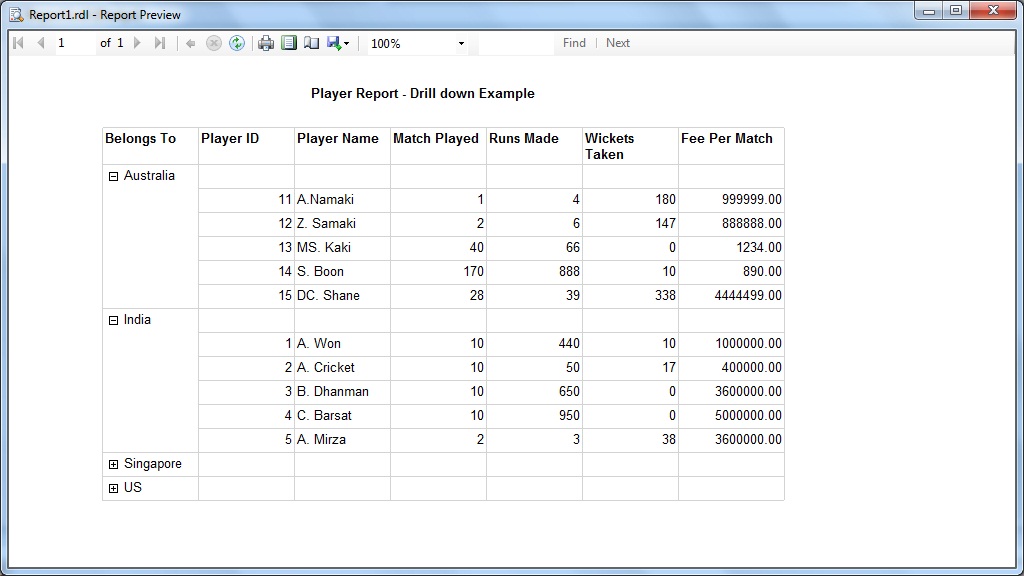
Step 8: Now it's all done. Run the application and the output is as under
(C) Working with Expressions and Custom code
In this section we will see how to use expression and custom code in our Report. We will learn these through some examples
Objective
What we are going to do is that, if a player has made more than 500 runs and has taken more than 10 wickets, then we are going to display the row and the particular columns with green color
For this, let us first click on the report design body and choose the report properties
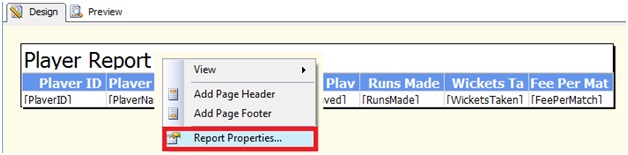
The Report Properties window opens up as shown under
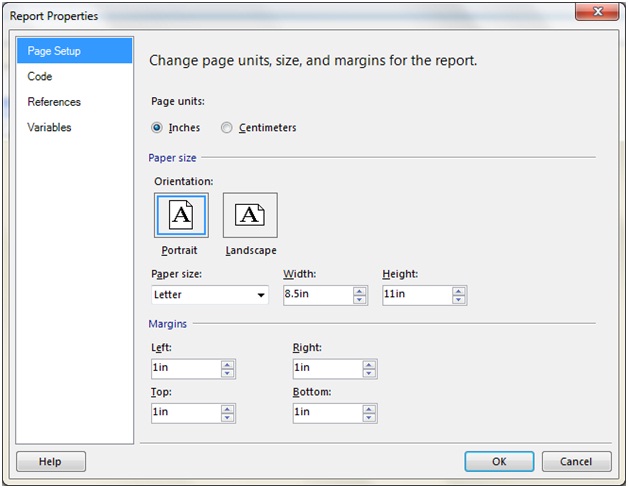
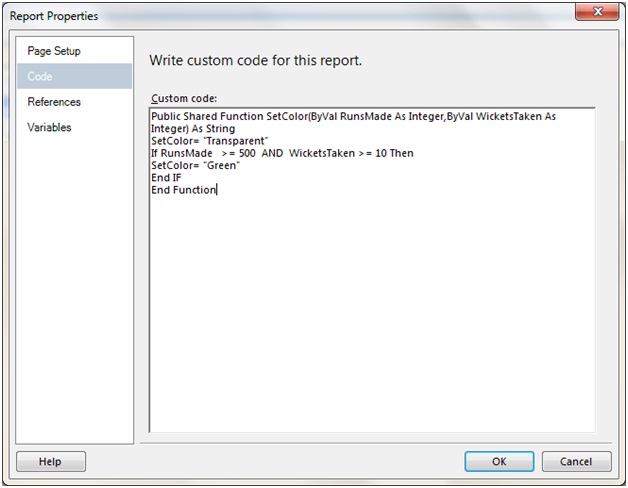
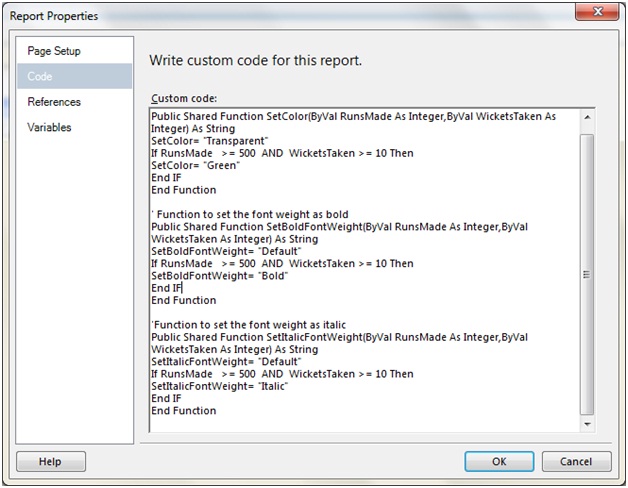
Navigate to the Code tab for writing the below custom code
Public Shared Function SetColor(ByVal RunsMade As Integer,ByVal WicketsTaken As Integer) As String SetColor= "Transparent" If RunsMade >= 500 AND WicketsTaken >= 10 Then SetColor= "Green" End IF End Function
The code is pretty simple to understand. We have declare a function by the name SetColor which accepts two integer variable,the first for the run and the next for the wickets taken. We set the initial value of the Setcolor to "Transparent" . Now if the condition meets , we will set the SetColor to "Green".
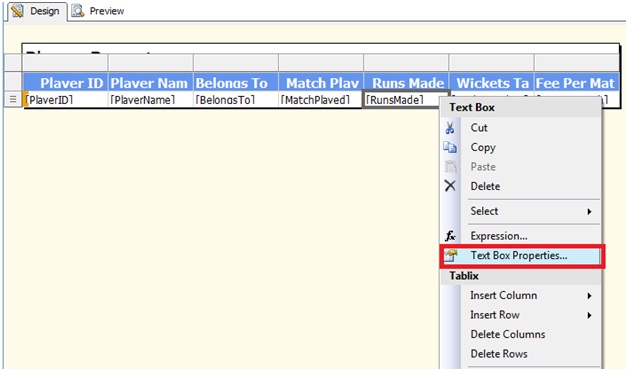
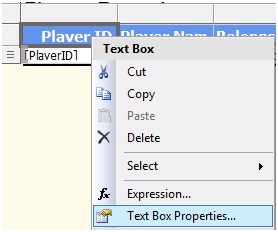
Next let us choose the RunsMade column and right click to open the TextBox menu from which we will choose the TextBox Properties
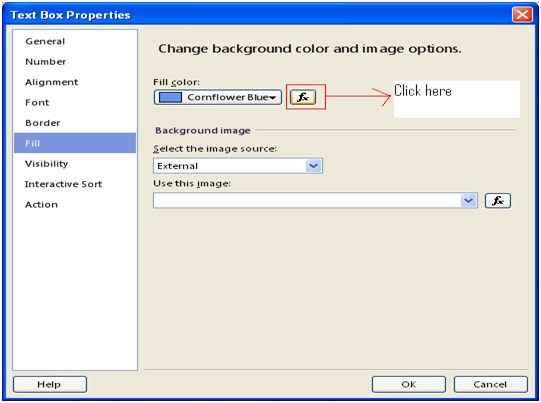
In the TextBox Properties window that appears, click on the Fill option and click the fx Button.
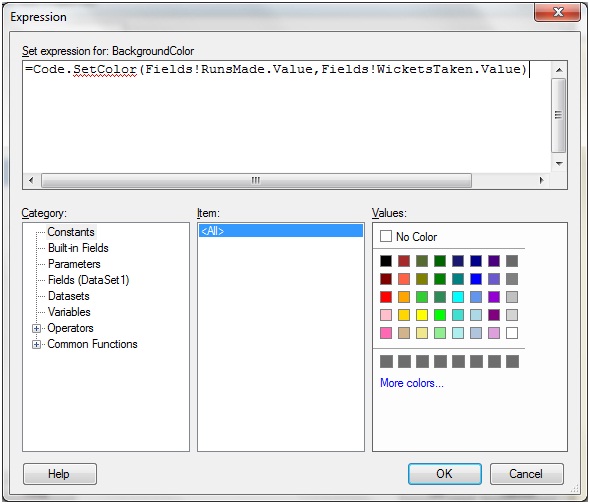
Enter the below expression in the Expression Window
=Code.SetColor(Fields!RunsMade.Value,Fields!WicketsTaken.Value)
Again the argument passing code snippet is very simple. In the first one, we are passing the RunsMade values while in the second we are passing the WicketsTaken values in the SetColor function that we just created.
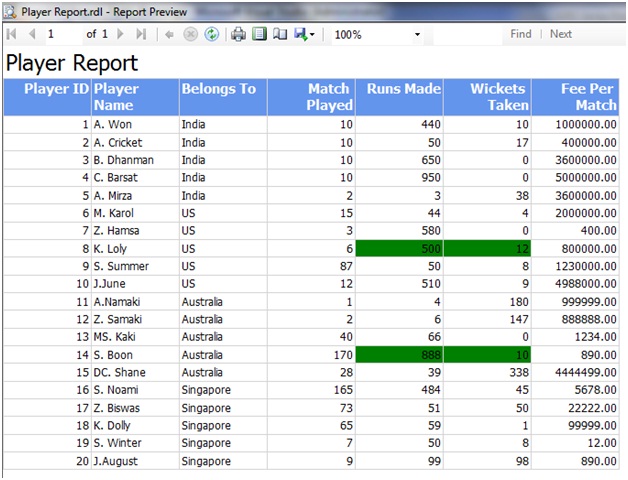
Click OK button and repeat the same for the Wickets Taken column.Once done, let us run the application and the result is as under
Let us add some more customization to our report. If the above criterion satisfies, we will make the Player Name value as bold and the Belongs To as Italic.
So let us add two more functions in the Custom Code as under.
Function : SetBoldFontWeight
' Function to set the font weight as bold Public Shared Function SetBoldFontWeight(ByVal RunsMade As Integer,ByVal WicketsTaken As Integer) As String SetBoldFontWeight= "Default" If RunsMade >= 500 AND WicketsTaken >= 10 Then SetBoldFontWeight= "Bold" End IF End Function
Function : SetItalicFontWeight
'Function to set the font weight as italic Public Shared Function SetItalicFontWeight(ByVal RunsMade As Integer,ByVal WicketsTaken As Integer) As String SetItalicFontWeight= "Default" If RunsMade >= 500 AND WicketsTaken >= 10 Then SetItalicFontWeight= "Italic" End IF End Function
The Custom Code area will now look as under
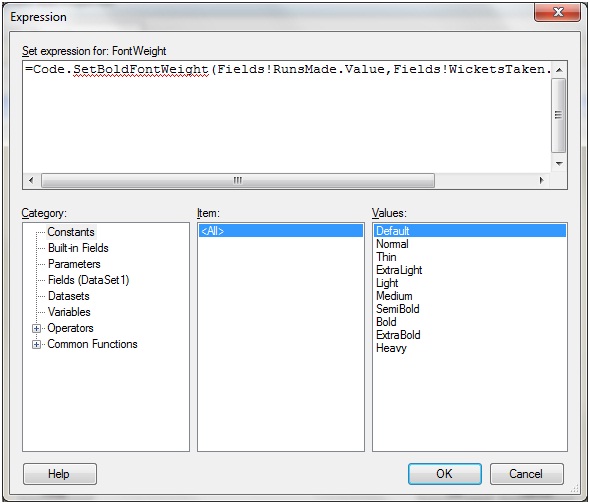
Next in the PlayerName column right click to bring the TextBox properties and from the Font option, choose the fn for Bold
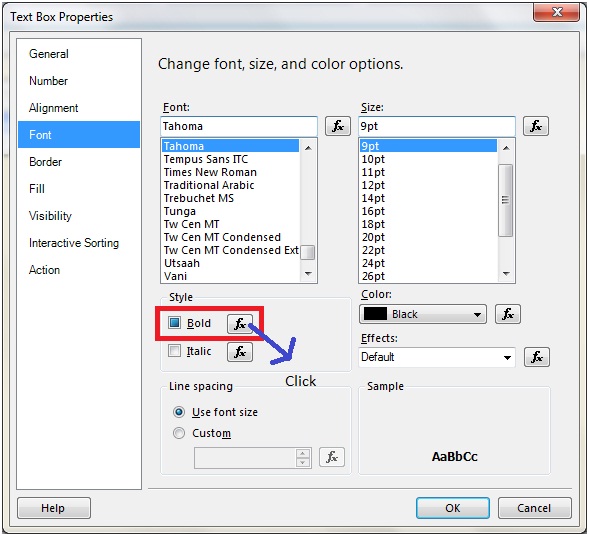
In the expression editor enter the below code
=Code.SetBoldFontWeight(Fields!RunsMade.Value,Fields!WicketsTaken.Value)
In the Belongs To column right click to bring the TextBox properties and from the Font option, choose the fn for Italic
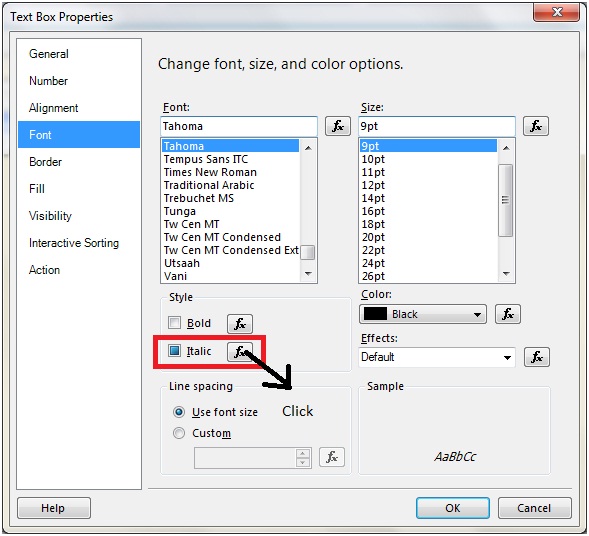
In the expression editor enter the below code
=Code.SetItalicFontWeight(Fields!RunsMade.Value,Fields!WicketsTaken.Value).
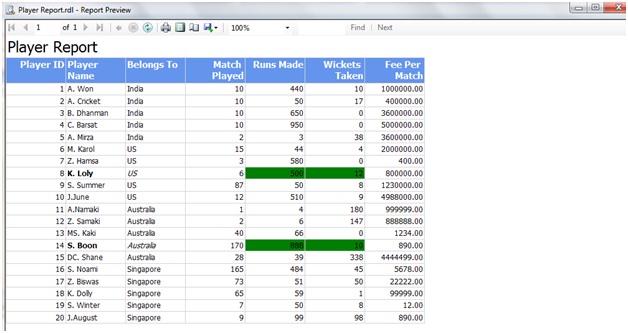
We are done. Run the report and the result is as under
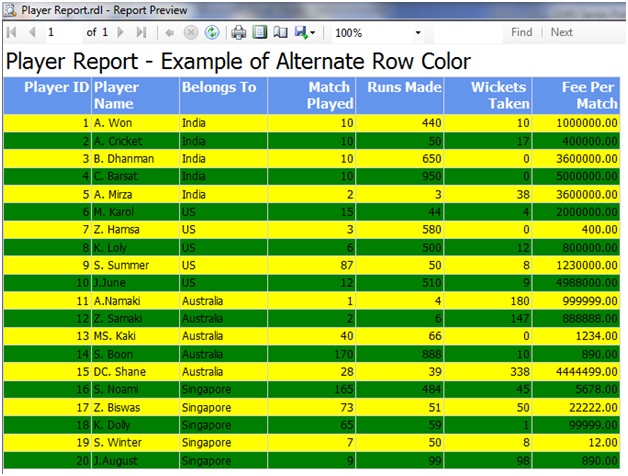
We will look into one more situation where we will generate alternate row color based on the Player ID column.
For this purpose add the below function in the custom codewindow
Public Shared Function SetAlternateRowColor(ByVal PlayerID As Integer) As String SetAlternateRowColor= "Yellow" If PlayerID Mod 2 = 0 Then SetAlternateRowColor= "Green" End IF End Function
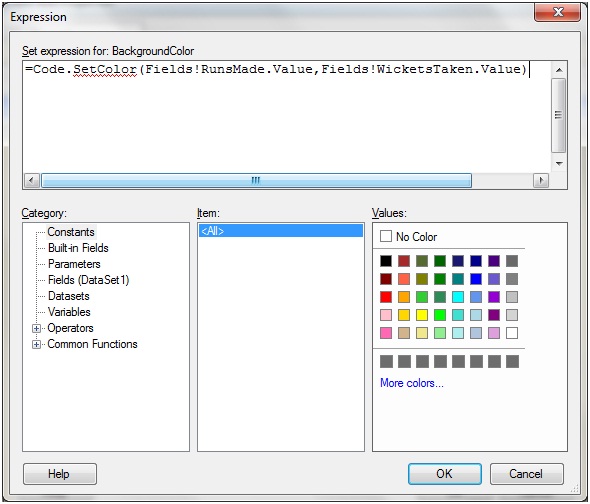
In this code, we are setting the color for even rows as Green .And for all the columns, let us write the below expression for the BackgroundColor
=Code.SetAlternateRowColor(Fields!PlayerID.Value)
The result is as under
Similarly we can set the alignments, hide rows depending on condition and many more stuffs by using expression and custom code.
(D)Working with Calculated fields
A Calculated field is a field that is derived from another field.
Objective
Suppose we want to twice the match fee for every player who ever has bagged more than 10 wickets and made a score of more than 500 runs. In such a case, that row will be will be green colored and the Calculated column value will be made bold.
Solution
Step 1: As a first step let us write the custom codes
Function: SetColor
Purpose: This function will set the color for the entire row to green if the runs made are more than or equals to 500 and wickets taken are more than or equals to 10.
'Function to set the color Public Shared Function SetColor(ByVal RunsMade As Integer,ByVal WicketsTaken As Integer) As String SetColor= "Transparent" If RunsMade >= 500 AND WicketsTaken >= 10 Then SetColor= "Green" End IF End Function
Function: SetBoldFontWeight
Purpose: This function will set the Row data to Bold for the Calculated column where the runs made by the Player are more than or equal to 500 and wickets taken are more than or equal to 10.
' Function to set the font weight as bold Public Shared Function SetBoldFontWeight(ByVal RunsMade As Integer,ByVal WicketsTaken As Integer) As String SetBoldFontWeight= "Default" If RunsMade >= 500 AND WicketsTaken >= 10 Then SetBoldFontWeight= "Bold" End IF End Function
Function: DoubleMatchFee
Purpose: Doubles the player match fees if the runs made by the Player are more than or equal to 500 and wickets taken are more than or equal to 10.
'Function to double the match fee Public Shared Function DoubleMatchFee(ByVal RunsMade As Integer,ByVal WicketsTaken As Integer,ByVal OriginalMatchFee As Integer) As Integer DoubleMatchFee= OriginalMatchFee If RunsMade >= 500 AND WicketsTaken >= 10 Then DoubleMatchFee= OriginalMatchFee * 2 End IF End Function
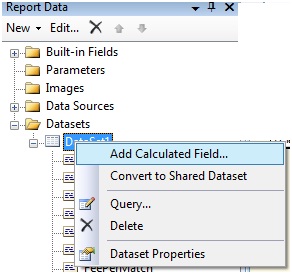
Step 2: Choose Data Set. Right Click and choose Add Calculated field
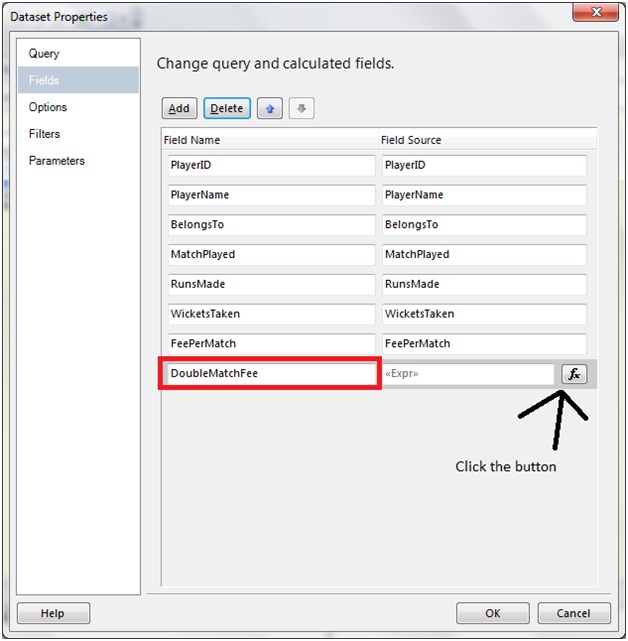
The DataSet Properties window opens up. Enter a Calculated field Name and click on the Expression button (fx)
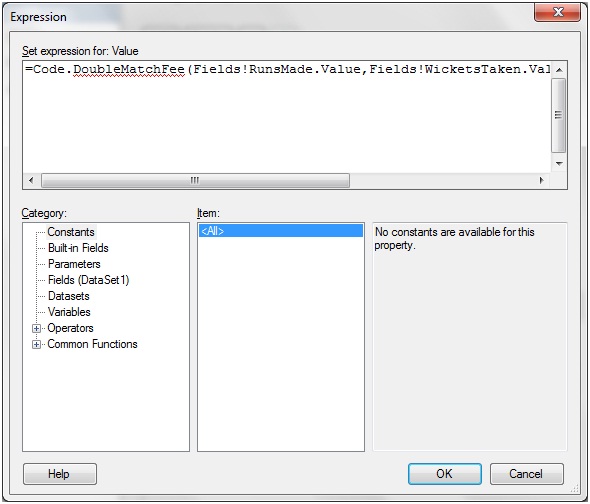
Next Add the below expression in the expression window
=Code.DoubleMatchFee(Fields!RunsMade.Value,Fields!WicketsTaken.Value,Fields!FeePerMatch.Value)
Click OK.
Step 3: Drag and drop the DoubleMatchFee column to the Report Designer.
Right click on the DoubleMatch Fee column and from the text box properties choose Font and let us write the below expression against the Bold Font Weight
=Code.SetBoldFontWeight(Fields!RunsMade.Value,Fields!WicketsTaken.Value)
For all other columns, let us enter the below expression against the Fill color obtained from the Text Box Properties
=Code.SetColor(Fields!RunsMade.Value,Fields!WicketsTaken.Value)
And we are done. Let us run the report and the output is as under
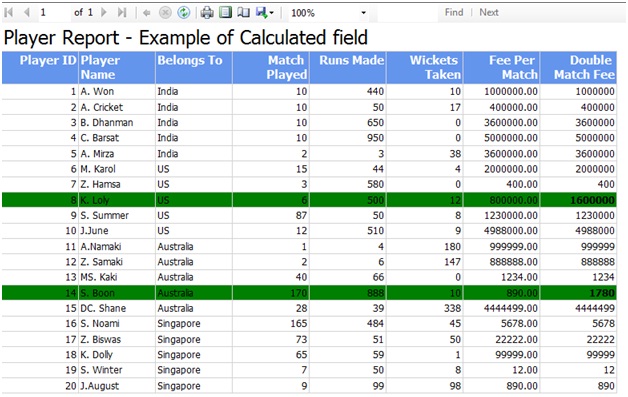
Hope that we are now comfortable to work with calculated filed.
(E) Sorting of Columns
In this section we will look into how to perform sorting of columns in the report. Column sorting is an important feature and it can be done from the database side also. But if the same data source is being use by various other application and each demands the result to be displayed in different order, then it is better to do the sorting in the client applications only as opposed to the database.
Let us look into the below steps as how can we perform the same in our report.
Step 1: Right click on the column header and choose Textbox Properties.
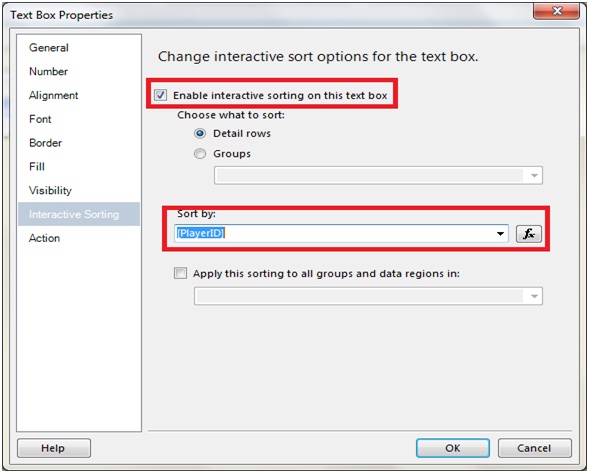
Step 2: Choose Interactive Sort from the Textbox properties dialog and
- Check the checkbox for Enable interactive sort on this Textbox
- Choose Player ID field from the Sort by drop down.
And we are done. Let us perform the same for PlayerName field.Now run the report
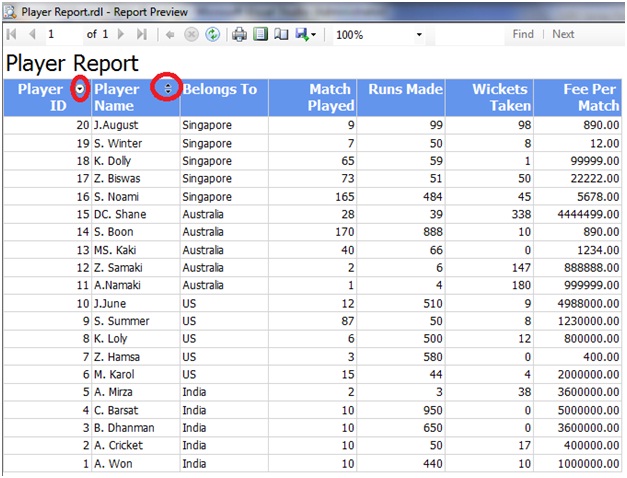
As can be seen that the sorting has been enabled on two columns and the report is presented in descending order of Player ID.
(F)Custom Paging in SSRS report
This section will give us the way of generating custom paging in our report. We will also learn the use of Global variable in doing so.
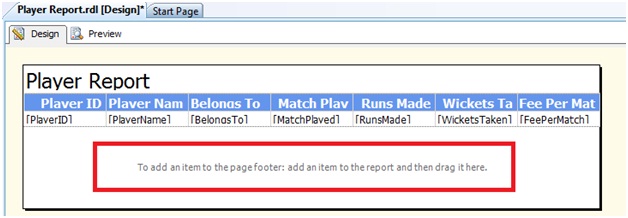
Step 1: In the report design screen, right click and from the context menu, choose Add Page Footer
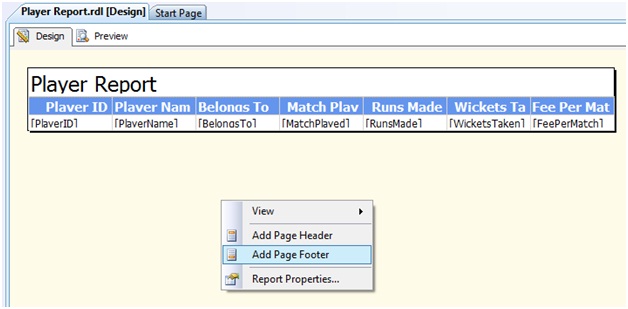
Once the Page Footer is added, we can then add controls to it.
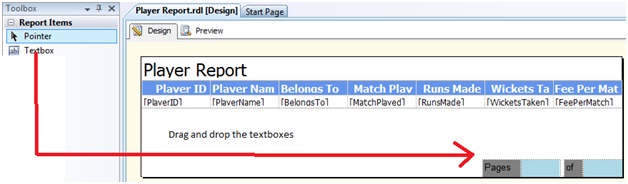
Step 2: Let us add four textboxes from the Report Item toolbox onto the designer as shown under
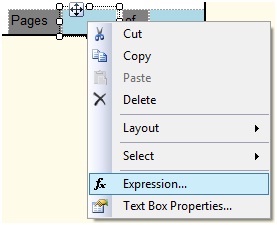
Step 3:Choose the 2nd textbox and click on the Expression
Step 4:From the expression window that opens, let us write the expression
=Globals!PageNumber
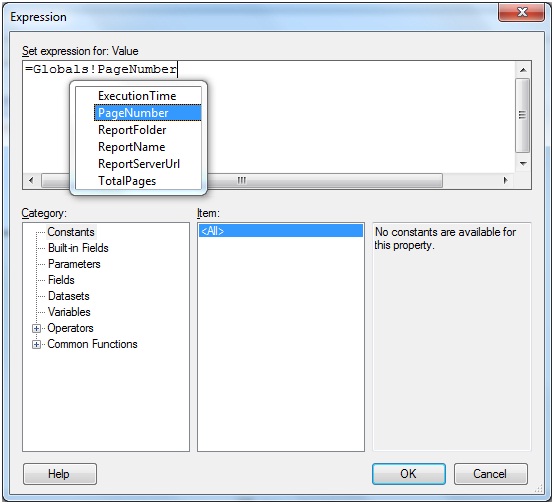
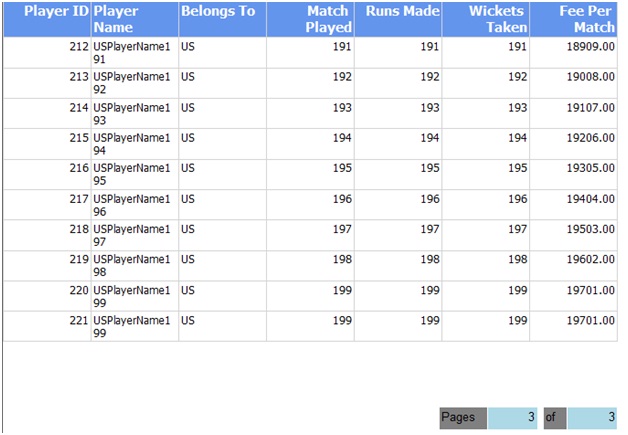
Similarly for the 4th Textbox, let us write the expression as =Globals!TotalPages.
Step 5:Run the report and the output is as under
 Twitter
 Facebook
 Digg
Digg Delicious
 Stumble


0 comments:
Post a Comment